Dashboard
The Dashboard allows you to view crucial statistical data about all of your forest stands at once and manage notifications. For convenience, it is divided into two sections:
- Statistics
- Notification manager
Statistics
This section displays the data about changes within forest stands over the selected period* in:
- Deforestation;
- Forest productivity;
- Water stress.
*you can select a period manually
To switch between different types of data, select indicators from a drop-down on the top horizontal bar.
You can also control the arrangement of the data by making the system show you:
- All groups of stands;
- 1 or more groups of stands;
- All stands that are not grouped.
Reports
You can download stats for each indicator as a spreadsheet in PDF or XLS formats. To download a stat report, click on the button in the upper right corner of your screen.
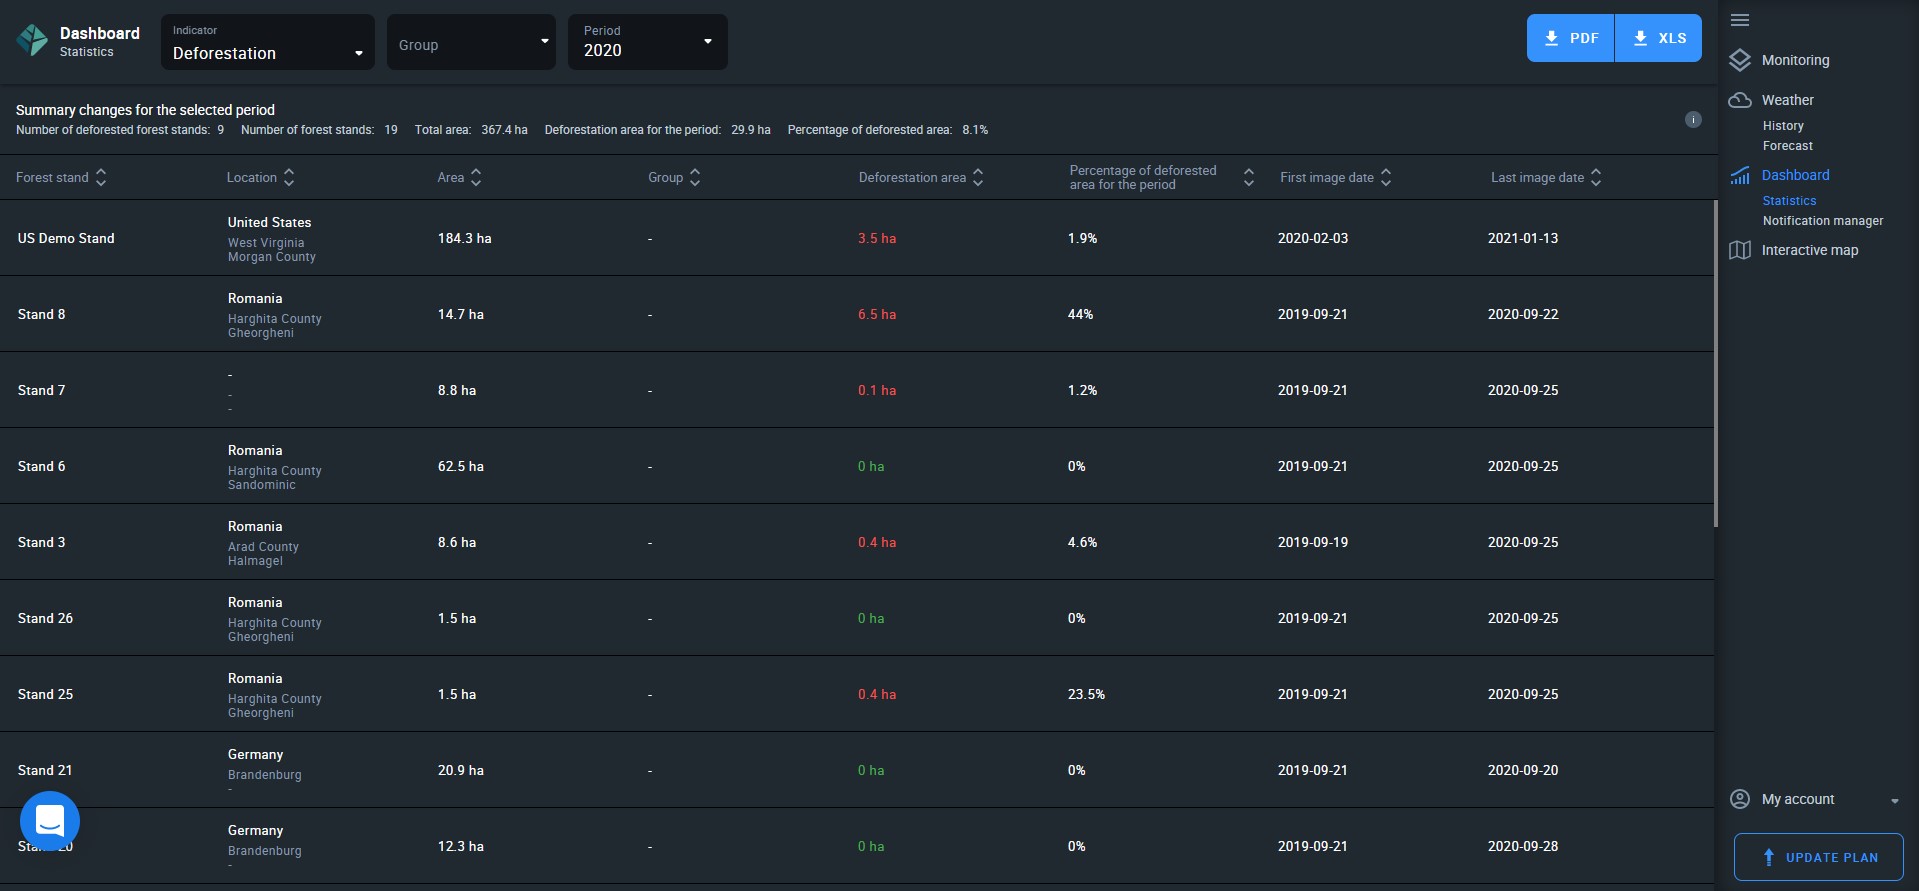
Deforestation Statistics
Statistics for deforestation are displayed for a period you can select in the Period drop-down menu on the top horizontal bar. The data is calculated based on the first and last cloudless images for the selected period.
There are four options:
- Month
- Quarter
- Year
- Custom dates*
*Contact our support team to set a custom period. You’ll need to add your phone number, company name, area size, and a short description of why you are making the request.
EOSDA Forest Monitoring interprets any loss of forest cover as deforestation, including
- logging operations,
- illegal logging,
- natural changes in forest cover.
Statistical data on deforestation is organized into columns:
- Forest stand name
- Location of forest stand
- Area of forest stand
- Group the stand is in
- Deforestation area*
- Deforestation percentage (extent)
- First image date
- Last image date
*how much forest has been lost over the specified period due to any causes.
Summary data on deforestation for all stands for a selected period are displayed right above the statistical data and include:
- total number of deforested stands
- total number of your forest stands
- total area of your forest stands
- total area of deforestation
- total percentage of deforested area*
*to give you an idea of the extent of deforestation that has occurred.
Note that calculating data can take some time. Data cannot be calculated if there are no available cloudless images for the selected period.
Important: if the selected period falls outside of the vegetation period for this stand, it will be highlighted in red.
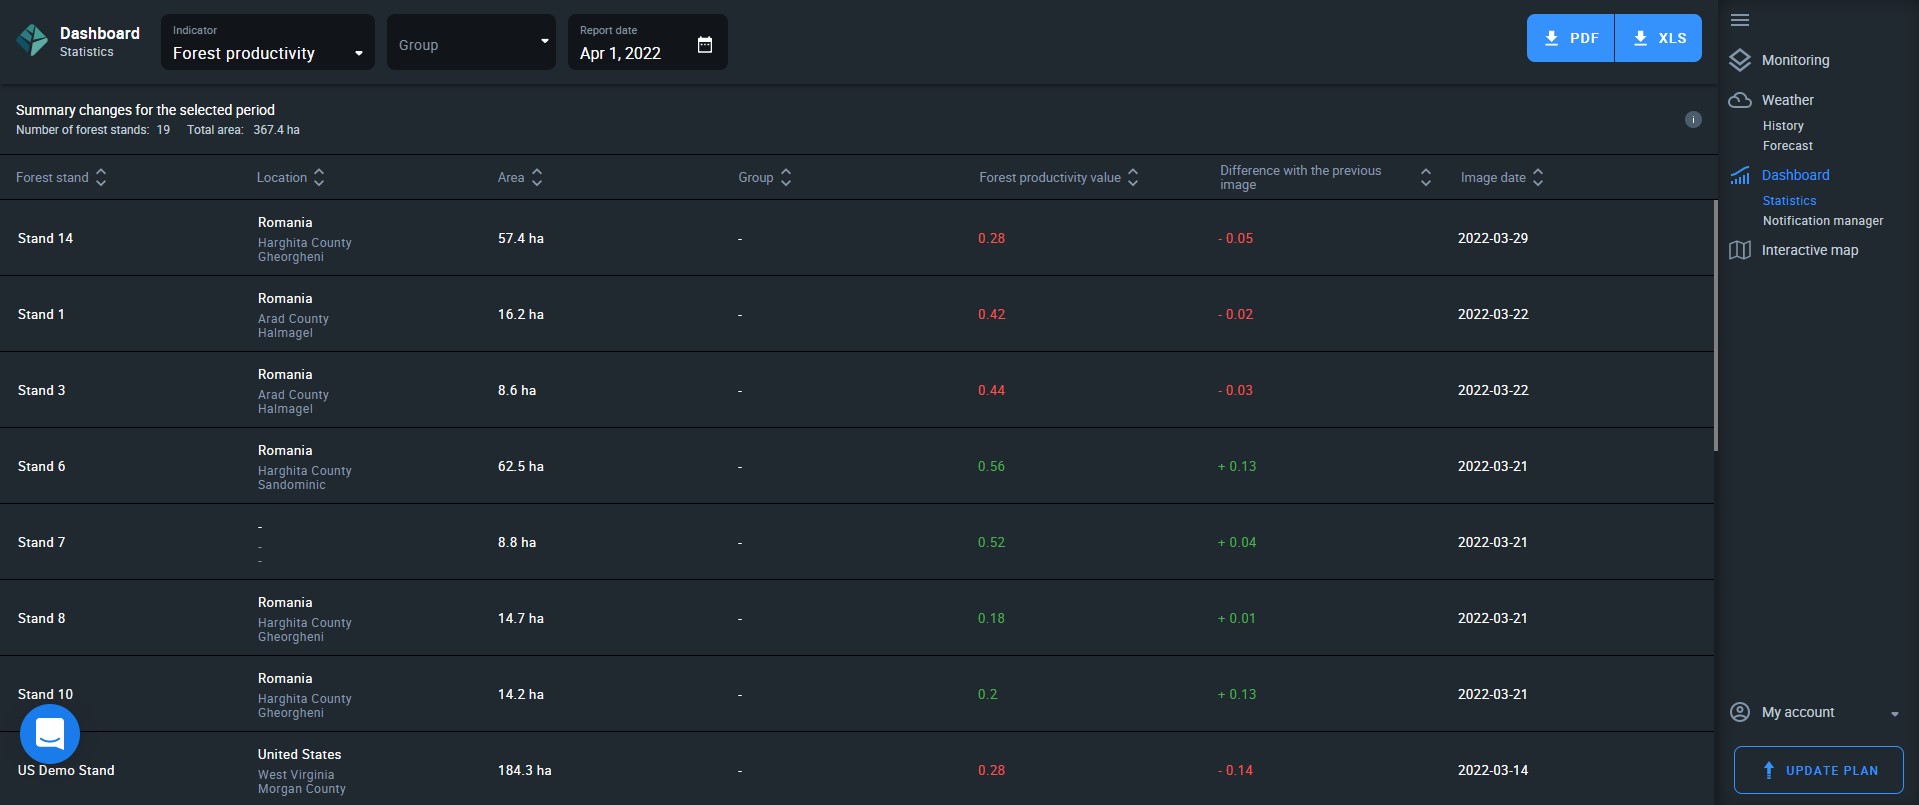
Forest Productivity Statistics
Statistical data on forest productivity is calculated as an index based on the last available image prior to or on the date you will select. The table will show you two values:
- Productivity for the selected date*
- Change in productivity since the previous satellite image
*If there was no satellite image of your stand for the selected date, the system will calculate the data based on the previous available image.
Forest productivity is measured as an index ranging from -1 (bare earth/poor health) to +1 (excellent health). Change in productivity compared to the previous available image is the difference between two index values.
E.g. You’ve selected a date with an index of 0.6, but on the date of the previous available image, the index measured at 0.8. Hence, the index of productivity has dropped by 0.2 units.
To select the date, click on the Report date box and pick a date on the interactive calendar. You can select report dates from January 1 2020 onward.
For convenience, summary data (total number of your forest stands and total area in ha or ac) are displayed right above the statistical data.
Water Stress Statistics
Statistical data on water stress is calculated as an index based on the last available image prior to or on the date you will select. The table will show you two values:
- Water stress for the selected date*
- Change in water stress since the previous satellite image
*If there was no satellite image of your stand for the selected date, the system will calculate the data based on the previous available image.
To select the date, click on the Report date box and pick a date on the interactive calendar. You can select report dates from January 1 2020 onward.
For convenience, summary data (total number of your forest stands and total area in ha or ac) are displayed right above the statistical data.

Notification Manager
Use this section of the dashboard to set up and manage regular email notifications on changes within your forest stands.
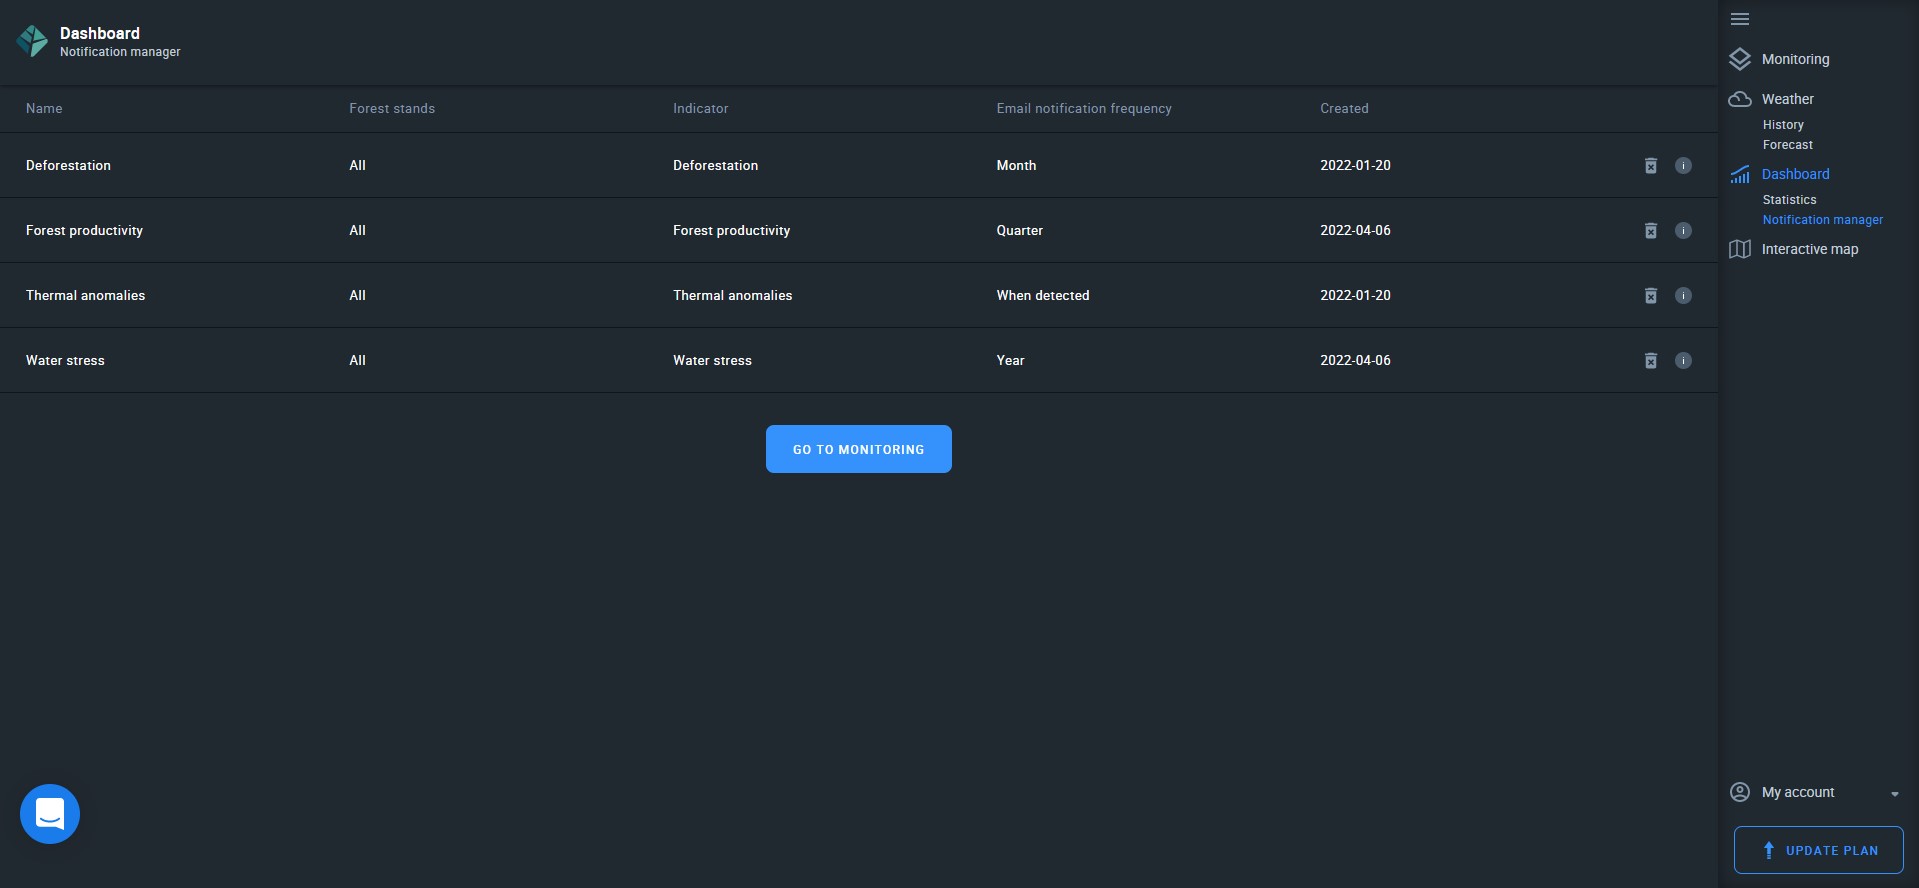
You can create 4 notifications (1 notification per indicator*):
- Forest productivity
- Water stress
- Deforestation
- Thermal anomalies
*you can only create 1 notification per 1 indicator. To change the name, frequency, or any other parameter of a notification, please delete and create it again.
Create a notification in 5 simple steps:
Step 1. Click on “create notification” at the center of the screen.
Step 2. Add a name. It can be anything that makes sense to you.
Step 3. Select an indicator from the drop-down.
Step 4. Select email notification frequency.
Step 5. Finish by clicking “Create”.
You can choose between several email notification frequency options:
- Once a month
- Once a quarter
- Once a year
These options apply to 3 indicators:
- Forest productivity
- Water stress
- Deforestation
The Thermal anomalies notification will be sent to your email on detection only.
Forest Productivity Notification
This email notification will contain a report on the most negative changes in productivity within your forest stands over the selected period. A report will only mention the top 3 stands (in case you have 3 or more) with the most negative changes.
The report should contain the following information about each stand:
- Location of the stand
- Name of the stand*
- Current forest productivity value for this stand
- Difference between the first and last images within the selected period
*the name you have given your stand
Water Stress Notification
This email notification will tell you which 3 of your forest stands (in case you have 3 or more) have the highest increase in water stress over the selected period. High increase in water stress may indicate drought conditions.
The report should contain the following information about each stand:
- Location of the stand
- Name of the stand*
- Current water stress value for this stand
- Difference between the first and last images within the selected period
*the name you have given your stand
Deforestation Notification
This email notification will contain a report on summary changes in forest cover due to deforestation (scheduled logging, illegal logging, natural causes, calamities, etc).
The report should contain the following information about all of your stands:
- Total number of forest stands you have
- Total number of stands where any type of deforestation has been detected
- Total area of forest stands you have
- Total deforested area
- Percentage of deforested area
The email may also include the information about the end of the vegetation period in one or more of your forest stands.
Thermal Anomalies Notification
This email notification will inform you about a potential fire threat within your forest stand(s). The notification will contain the number of forest stands. To further understand the danger of the fire threat, click on the GO TO MONITORING button.