Zoning
Zoning is an effective tool for carrying out the variable-rate application of seeds, fertilizers, differential irrigation, and differential crop rotation, as well as for determining optimal zones (areas) for precision soil sampling. Based on the in-zone data measured using a vegetation index, a map can be created on the platform and imported to the agriculture equipment. The equipment can then follow the map as a script, applying the precisely calculated amount of seeds and/or fertilizers to specific zones (areas) within a field. Variable-rate application of inputs and precision soil sampling are highly cost-effective since they allow you to allocate resources more rationally. VRA of inputs is also more sustainable as it can help prevent the overuse of nitrogen, phosphorus, and potassium fertilizers, as well as of crop protection substances.

Getting started with Zoning
1) On the right sidebar menu, click Zoning.
2) You will be directed to the list of fields.
3) Select the field you want from the list by clicking it.
4) You will be directed to the page where maps are created.
5) Here, you can create:
- Multilayer map for variable-rate application of inputs based on combined data of multiple selected layers, e.g. vegetation index and elevation.
- Vegetation map for variable-rate nitrogen fertilizer application.
- Productivity map for variable-rate potassium and phosphorus fertilizer application, variable-rate seed planting, and for soil sampling.
6) For more details, refer to the Create multilayer maps, Create vegetation maps and Create productivity maps sections.
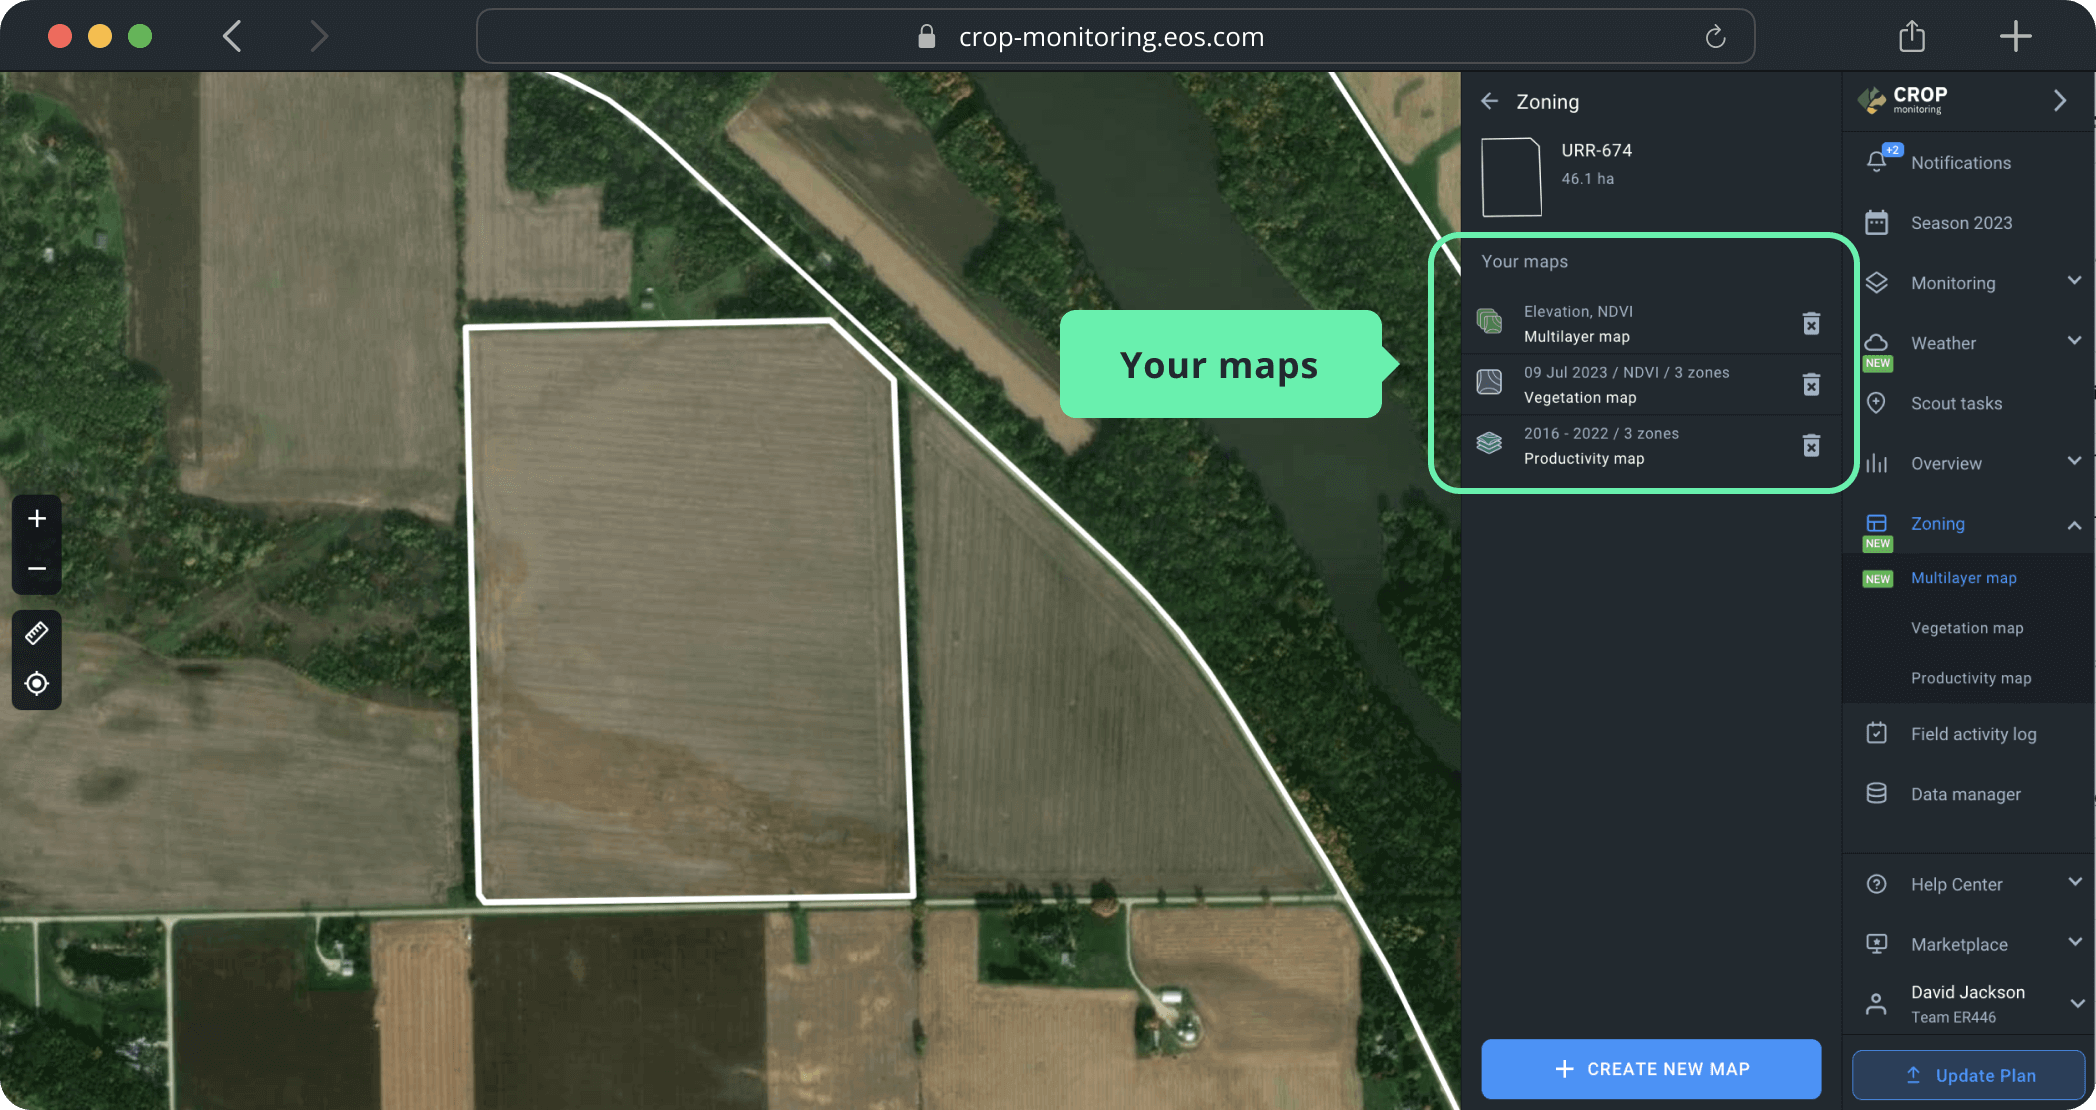
7) If you’ve already created maps for this field, you will see a list of maps “Your maps”. For more details, refer to the section Save the created maps.
Create multilayer maps
Slopes, hills, and pits are among the factors causing humus leaching and changes in the chemical soil composition, which might decrease field productivity. Field elevation also influences vegetation growth and, therefore, determines the amount of fertilizer, seed and/or pesticide to be applied.
A Multilayer map allows combining the vegetation and elevation layers to create an optimal VRA map and improve productivity.
Create map
You can create a Multilayer map in a few simple steps:
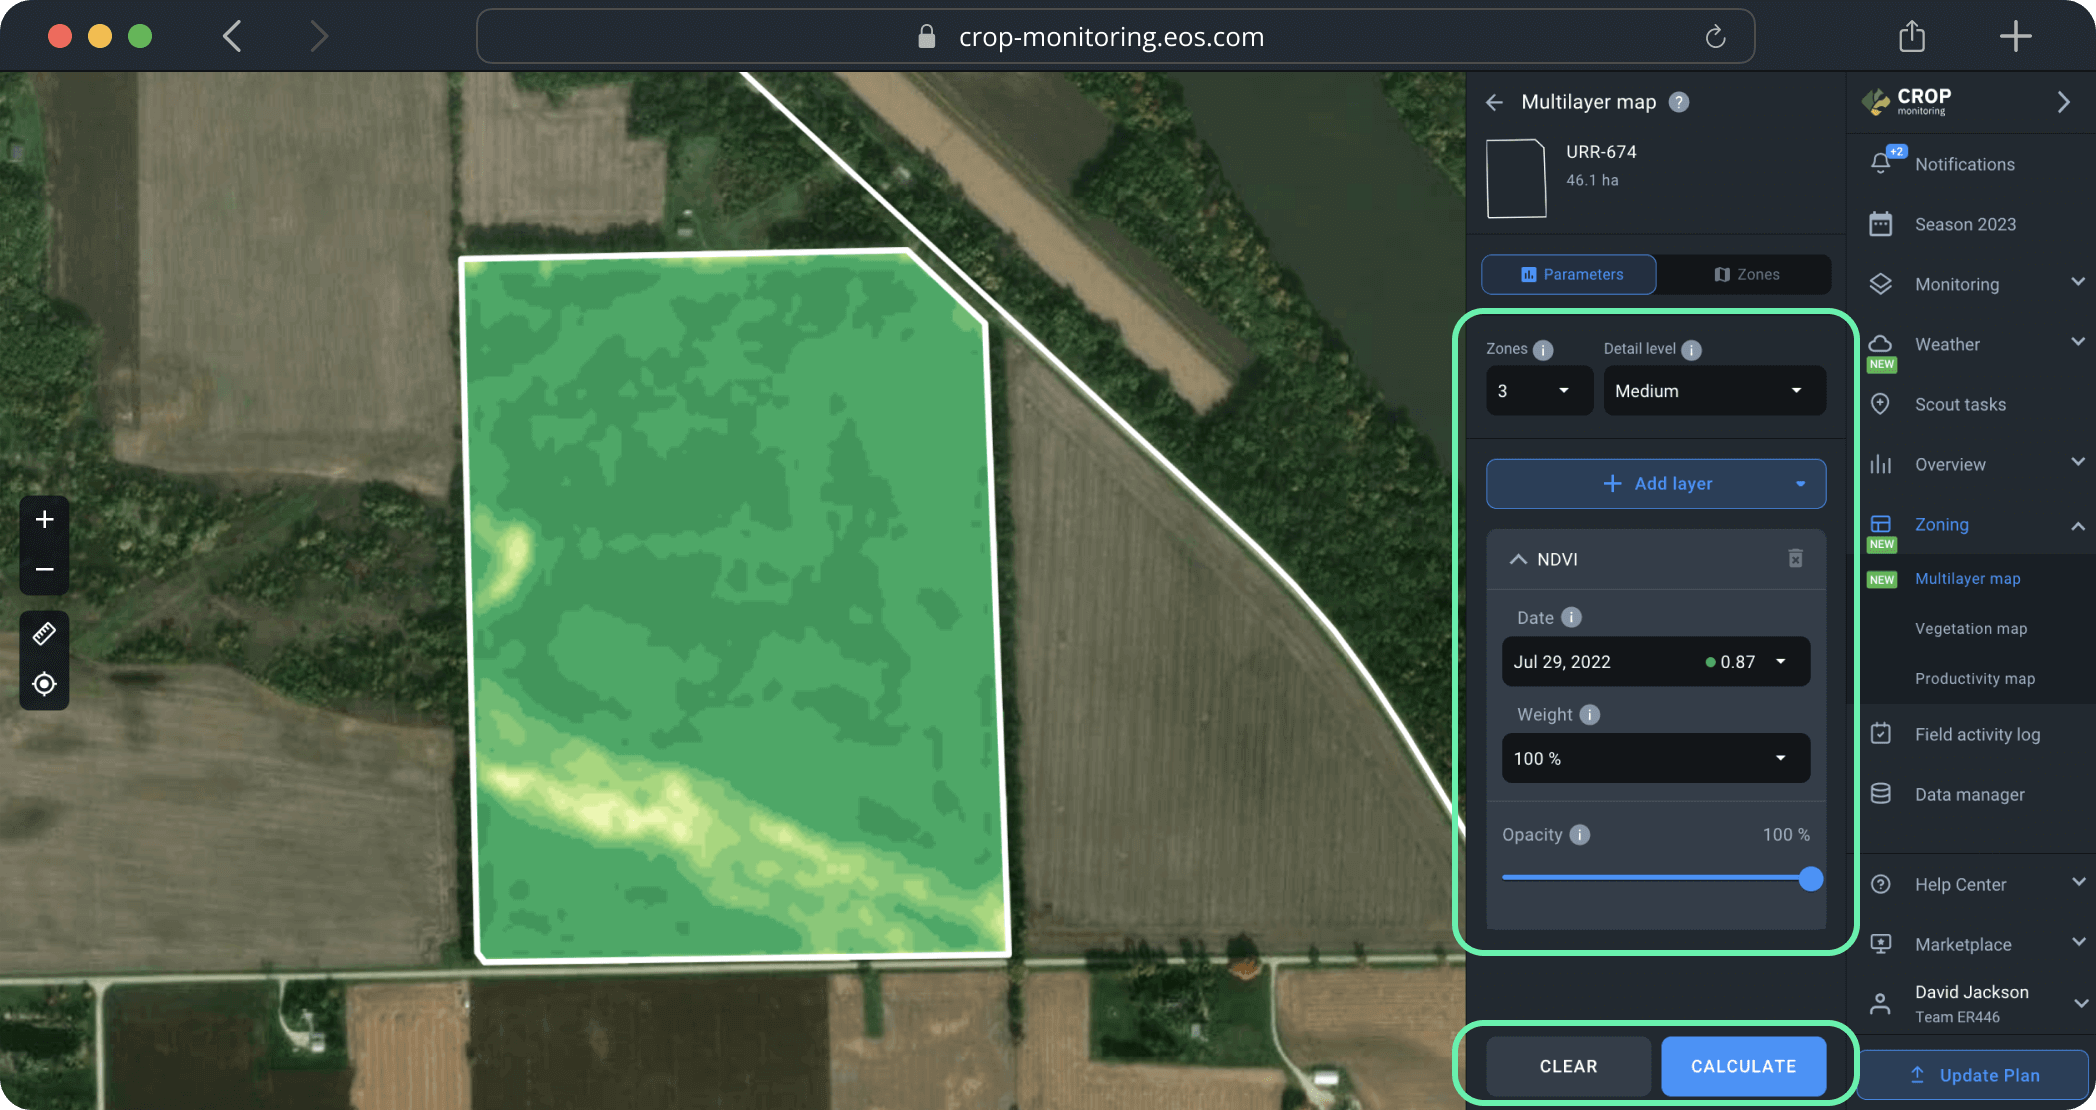
Step 1. Set the parameters needed to create zones on the map:
1) Number of zones
You can choose between 2 and 7 zones on EOSDA Crop Monitoring, according to your needs (e.g. field area). For most fields, 3 to 5 zones are an optimal choice.
2) Level of detail
You can also manage the level of detail the map will show you.
Tip: Use high to maximum detail for small fields and medium to low detail for large fields.
Step 2. Pick the layers to build the map by clicking +Add layer and choosing from the drop-down list of available layers*:
1) Vegetation indices
- NDVI
- NDRE
- MSAVI
- RECl
2) Moisture indices
- NDMI
3) Elevation map
You can select up to 5 different layers. To preview all the layers you’ve added, scroll down below the +Add layer button.
*This list will also show you any custom indices available in your account.
Step 3. After you’ve picked the layers, select a date of a satellite image the map will be based on. You need to pick the date for each individual layer.
Note: Elevation map layer does not require a date of a satellite image.
Step 4. Select the image weight.
Weight indicates how much each layer will count in calculation. For example, NDVI weight set at 100% and Elevation map weight at 50% will generate a map where the NDVI parameter relates to the Elevation parameter as 2:1.
We also recommend using Opacity tool at this stage.
Opacity enables the comparison of map layers. For example, you can compare vegetation and elevation to determine how they correlate with each other. Opacity does not affect calculation and the resulting map.
To work with Opacity more conveniently, you can collapse the layer by clicking on its name.
After you’ve selected all the needed parameters within the layers, click “Calculate”.
The calculation of zone distribution across the field takes just a few seconds. The result is the map you can see on the left and the zones for variable rate application of inputs on the right. To apply fertilizers according to the Multilayer map, you will need to manually input the amount of fertilizer per 1 hectare/acre for each zone. The system will automatically calculate the total amount to be applied in each zone as units of measurement (UOM).
Note: Zone 1 will have the highest values.
By switching to the Parameters tab, you can review the ready map and compare it with the selected layers, e.g. to see how elevation affects a certain area (zone) of a field. This information will help you adjust the fertilizer amount for more effective results.

Export map
The final step is to export the map from the platform by clicking EXPORT below.
Once you click the EXPORT button, you will need to choose the file format from the drop-down list. Learn more about different file formats for the agricultural machinery available on the platform here.
Select the file format that suits you best and click on it. The download will start automatically. You can also hover your mouse over the file format and choose between two options:
1) Get link to this map. The link to the map will be saved to the clipboard*. You can share this link with anyone.
2) Download this map. The Multilayer map will be saved to your device as a file.
*The link is only valid for 10 days after being copied.
Create vegetation maps
The vegetation map allows you to determine the areas within a field with variations in the state of vegetation (low to high) and adjust nitrogen fertilizer application, irrigation, and crop protection activities accordingly. We use a color grade scheme to visualize the variations in the state of crops across the field. The red color may indicate the poor state/health of the crops that are growing in this area of the field, while the green area usually indicates well-performing crops. The decision on the amount of N fertilizer, irrigation method, and proper crop protection also depends on the physical characteristics of a field, such as elevation differences and others.
Create map
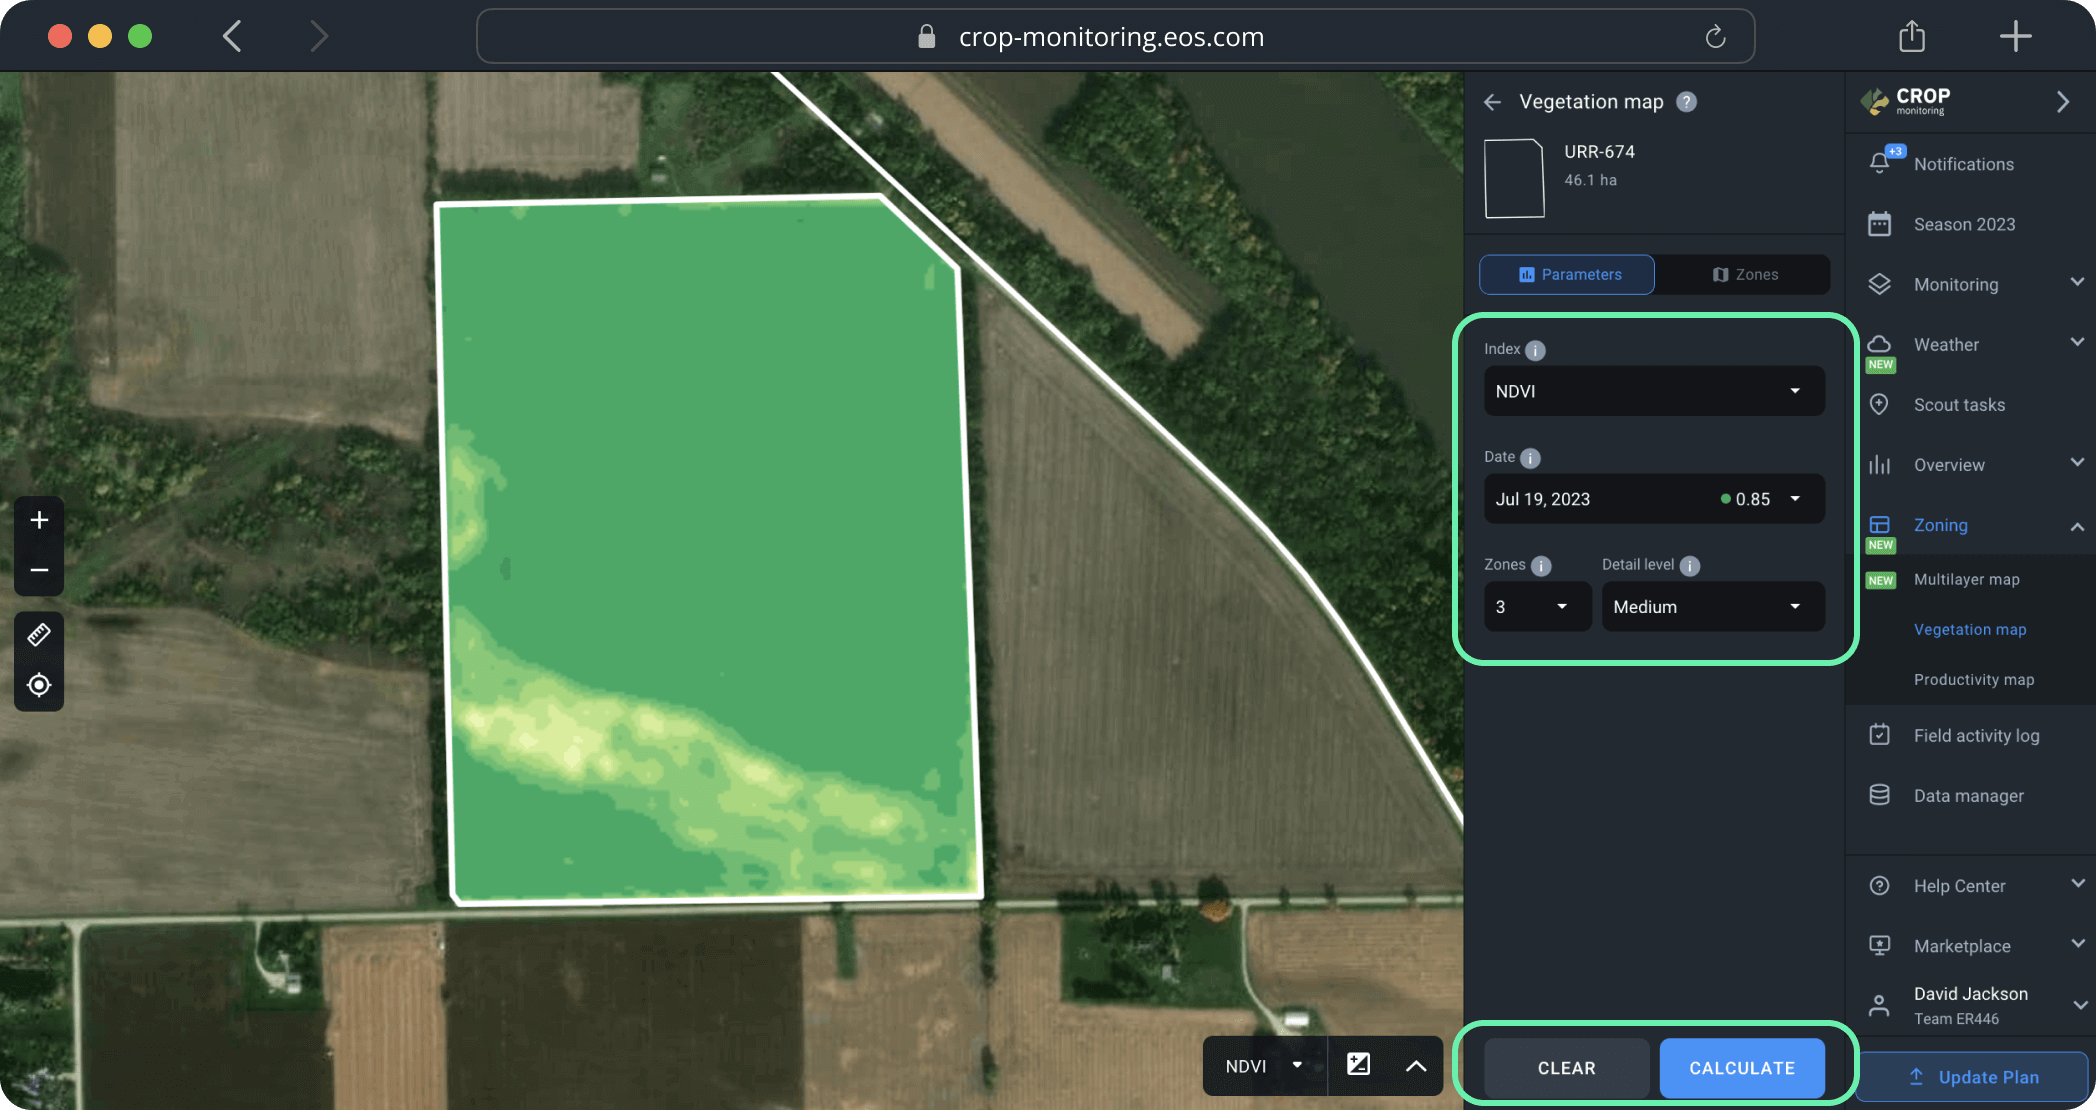
You can create a vegetation map in just a few simple steps.
First, select an appropriate vegetation index in the drop-down menu. The map will be based on all the different index values detected across the field.
Next, select a satellite image in the “Date” field. For the vegetation map, you will need one of the latest available images.
Tip: You can preview a satellite image while selecting the date or index before you create the vegetation map. This will allow you to settle on the right image without the need to check each one, saving you time.
Finally, select the number of zones and the detail level.
Tip: Maximum detail level works best for small-scale fields, providing you with highly detailed maps. Decrease detail level for larger fields: medium for average-size fields; minimum for larger fields.
Now, all you need to do is to click CALCULATE.
The calculation of zone distribution across the field takes just a few seconds. The result is the map you can see on the left and the zones for variable rate application of inputs on the right.
Make sure there haven’t been any anomalies in the satellite image the map is based on by moving the Opacity slider.
Opacity is set to 80% by default for any obstructions/anomalies to show up in the image overlapping with the vegetation map. Moving the slider all the way to the left (0%) will allow you to see the natural view. If no anomalies are to be seen, you can move the Opacity slider all the way to the right (100%), to switch to the vegetation map view.
To apply fertilizers according to the vegetation map, you will need to manually input the amount of fertilizer per 1 hectare/acre for each zone. The system will automatically calculate the total amount to be applied in each zone as units of measurement (UOM).
Note: the green and red colors on the maps stand for relatively higher and lower vegetation.
Export map
The final step is to export the map from the platform by clicking EXPORT below.
Once you click the EXPORT button, you will need to choose the file format from the drop-down list. Learn more about different file formats for the agricultural machinery available on the platform here.
Select the file format that suits you best and click on it. The download will start automatically. You can also hover your mouse over the file format and choose between two options:
1) Get link to this map. The link to the map will be saved to the clipboard*. You can share this link with anyone.
2) Download this map. The vegetation map will be saved to your device as a file.
*The link is only valid for 10 days after being copied.
Create productivity maps
A productivity map is your guide to the variable-rate application of potassium (K) and phosphorus (P) fertilizers, differential sowing, and precision soil sampling. The map is based on the NDVI values for the field measured over a selected period of time. The red color usually indicates low productivity of soil, while the green areas stand for higher productivity.
The productivity map’s algorithm analyzes all the cloudless satellite images available for the selected period. It makes sure that any anomalies are excluded from the calculation of the map to achieve the highest possible precision.
Create map
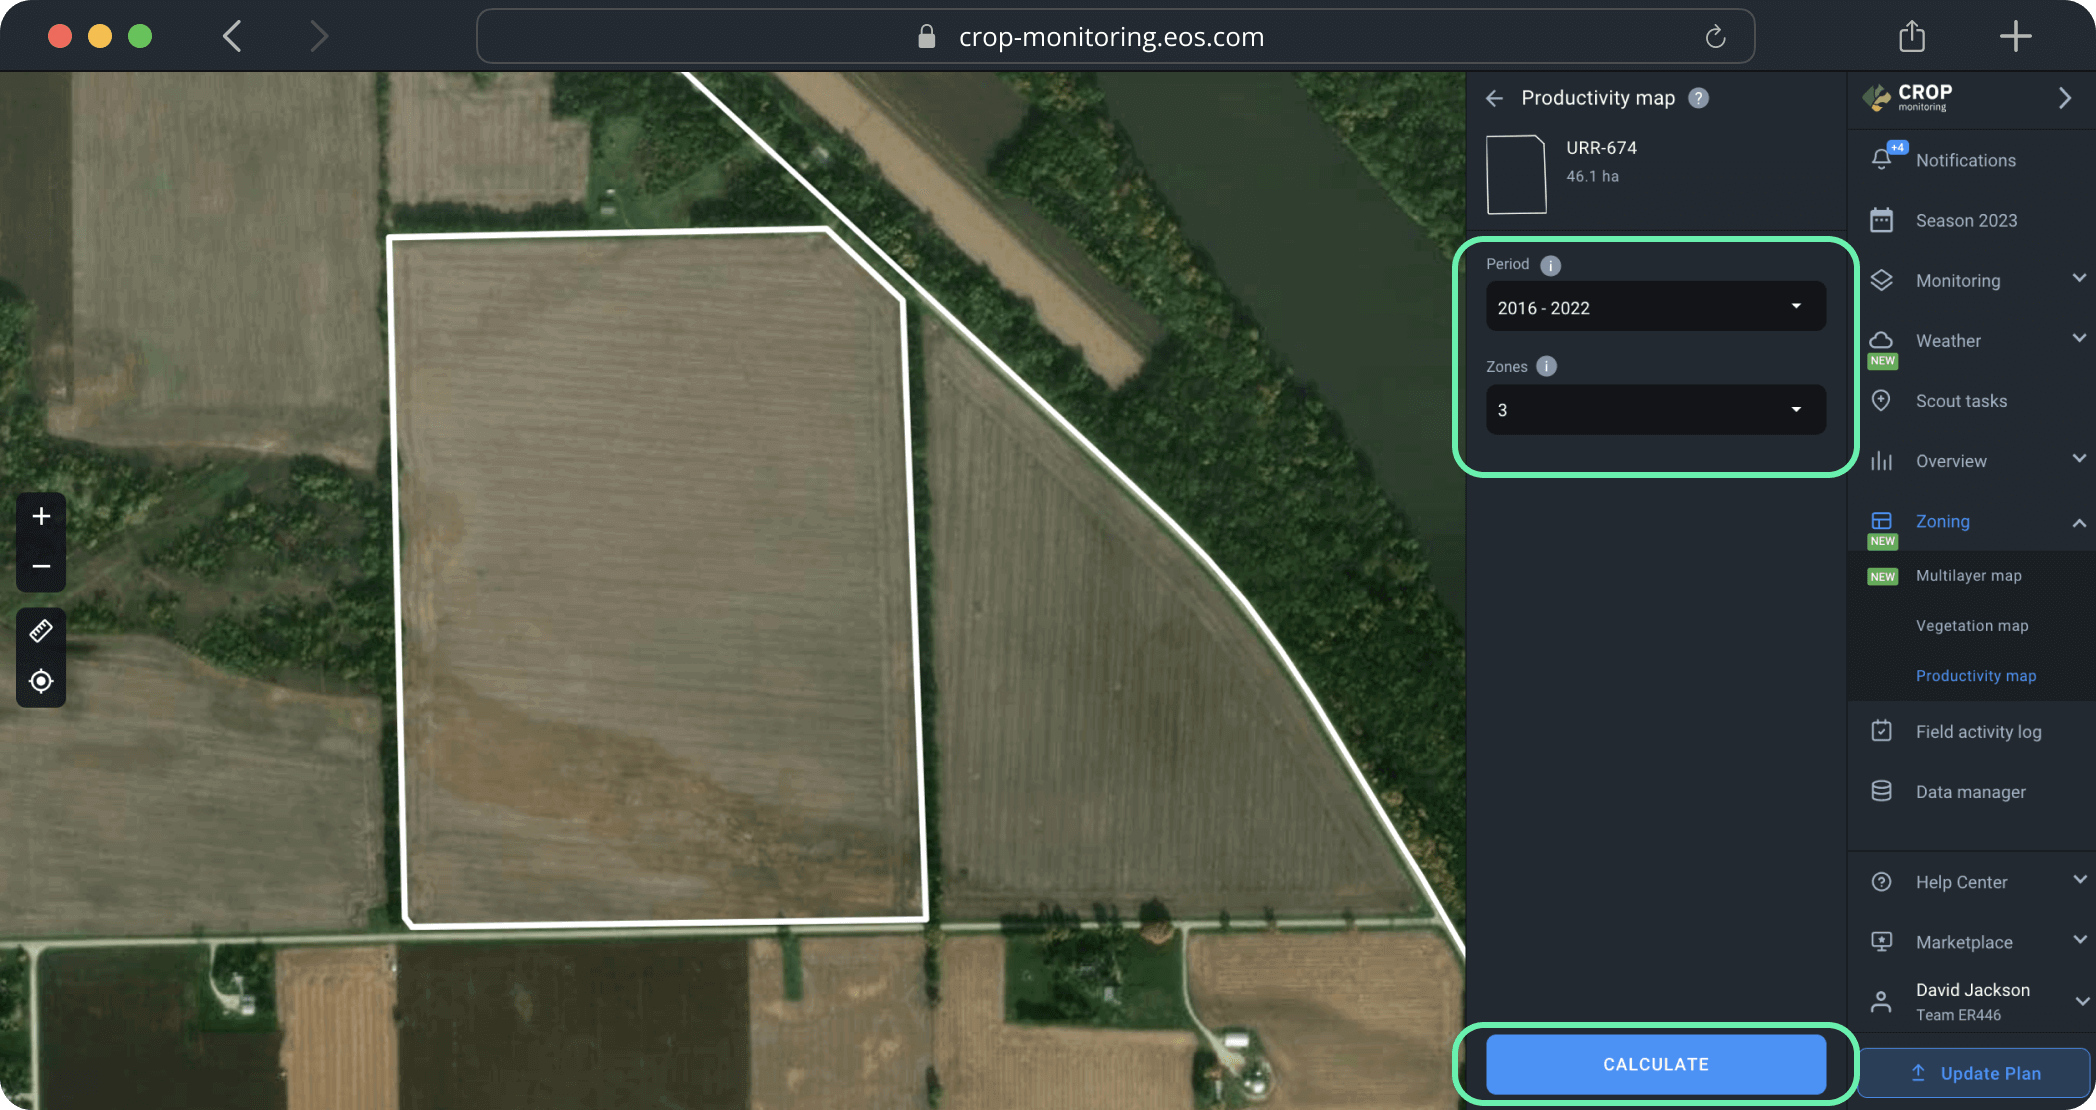
To create a productivity map, you need to select a period of time that you think is the most representative of the field’s soil’s average productivity over time. Currently, you can select a period that starts as far back as 2016.
Tip: We recommend using the maximum possible range of dates for the most precise evaluation of average productivity.
Next, select the number of zones. The default setting is 3 zones, but you can choose between 2 and 7 zones depending on the size of the field and your needs.
After you’ve selected the time period and the number of zones, click CALCULATE.
Tip: To ensure the accuracy of the calculations, do not select the current year if the field has not been harvested yet.
The calculations will take no more than a minute.
Use the productivity map to increase yield by applying fertilizers and seeds more efficiently and performing more cost-effective soil sampling.
To apply fertilizers or seeds according to the productivity map, you will need to manually input the amount per 1 hectare/acre for each zone. The system will automatically calculate the total amount to be applied in each zone as units of measurement (UOM).
Export map
The final step is to export the map from the platform by clicking EXPORT below.
Once you click the EXPORT button, you will need to choose the file format from the drop-down list. Learn more about different file formats for the agricultural machinery available on the platform here.
Select the file format that suits you best and click on it. The download will start automatically. You can also hover your mouse over the file format and choose between two options:
1) Get link to this map. The link to the map will be saved to the clipboard*. You can share this link with anyone.
2) Download this map. The productivity map will be saved to your device as a file.
*The link is only valid for 10 days after being copied.
Calculate savings on variable-rate application
Zoning allows you to avoid waste of inputs (seeds & fertilizers alike), which is good for your budget and for the environment.
Use the total savings calculator tool to see exactly how much you save on variable-rate application of inputs vs flat-rate application of inputs moneywise and in terms of resources.
Note: You can calculate savings after you’ve created a VRA map.
1) Enter the price for one unit of measurement of inputs (UOM) in the “Price per one unit” field. The currency for your location automatically applies.
2) Next, enter the amount of inputs that will go in each zone as UOM per ha/ac.
To calculate your savings thanks to variable-rate application of inputs, first calculate the cost of the flat-rate application of inputs and their amount. When that is done, you can calculate savings by comparing them to the flat rate data.
1) Now, you need to scroll down to the “Total savings calculator” section.
2) Enter the data for flat-rate application of fertilizer as UOM per ha or UOM per acre, depending on your preferences. This is the amount of inputs you would apply in a traditional way (without using Zoning).
3) The system will automatically calculate the amount of fertilizer saved using the VRA application method and the total savings in money.
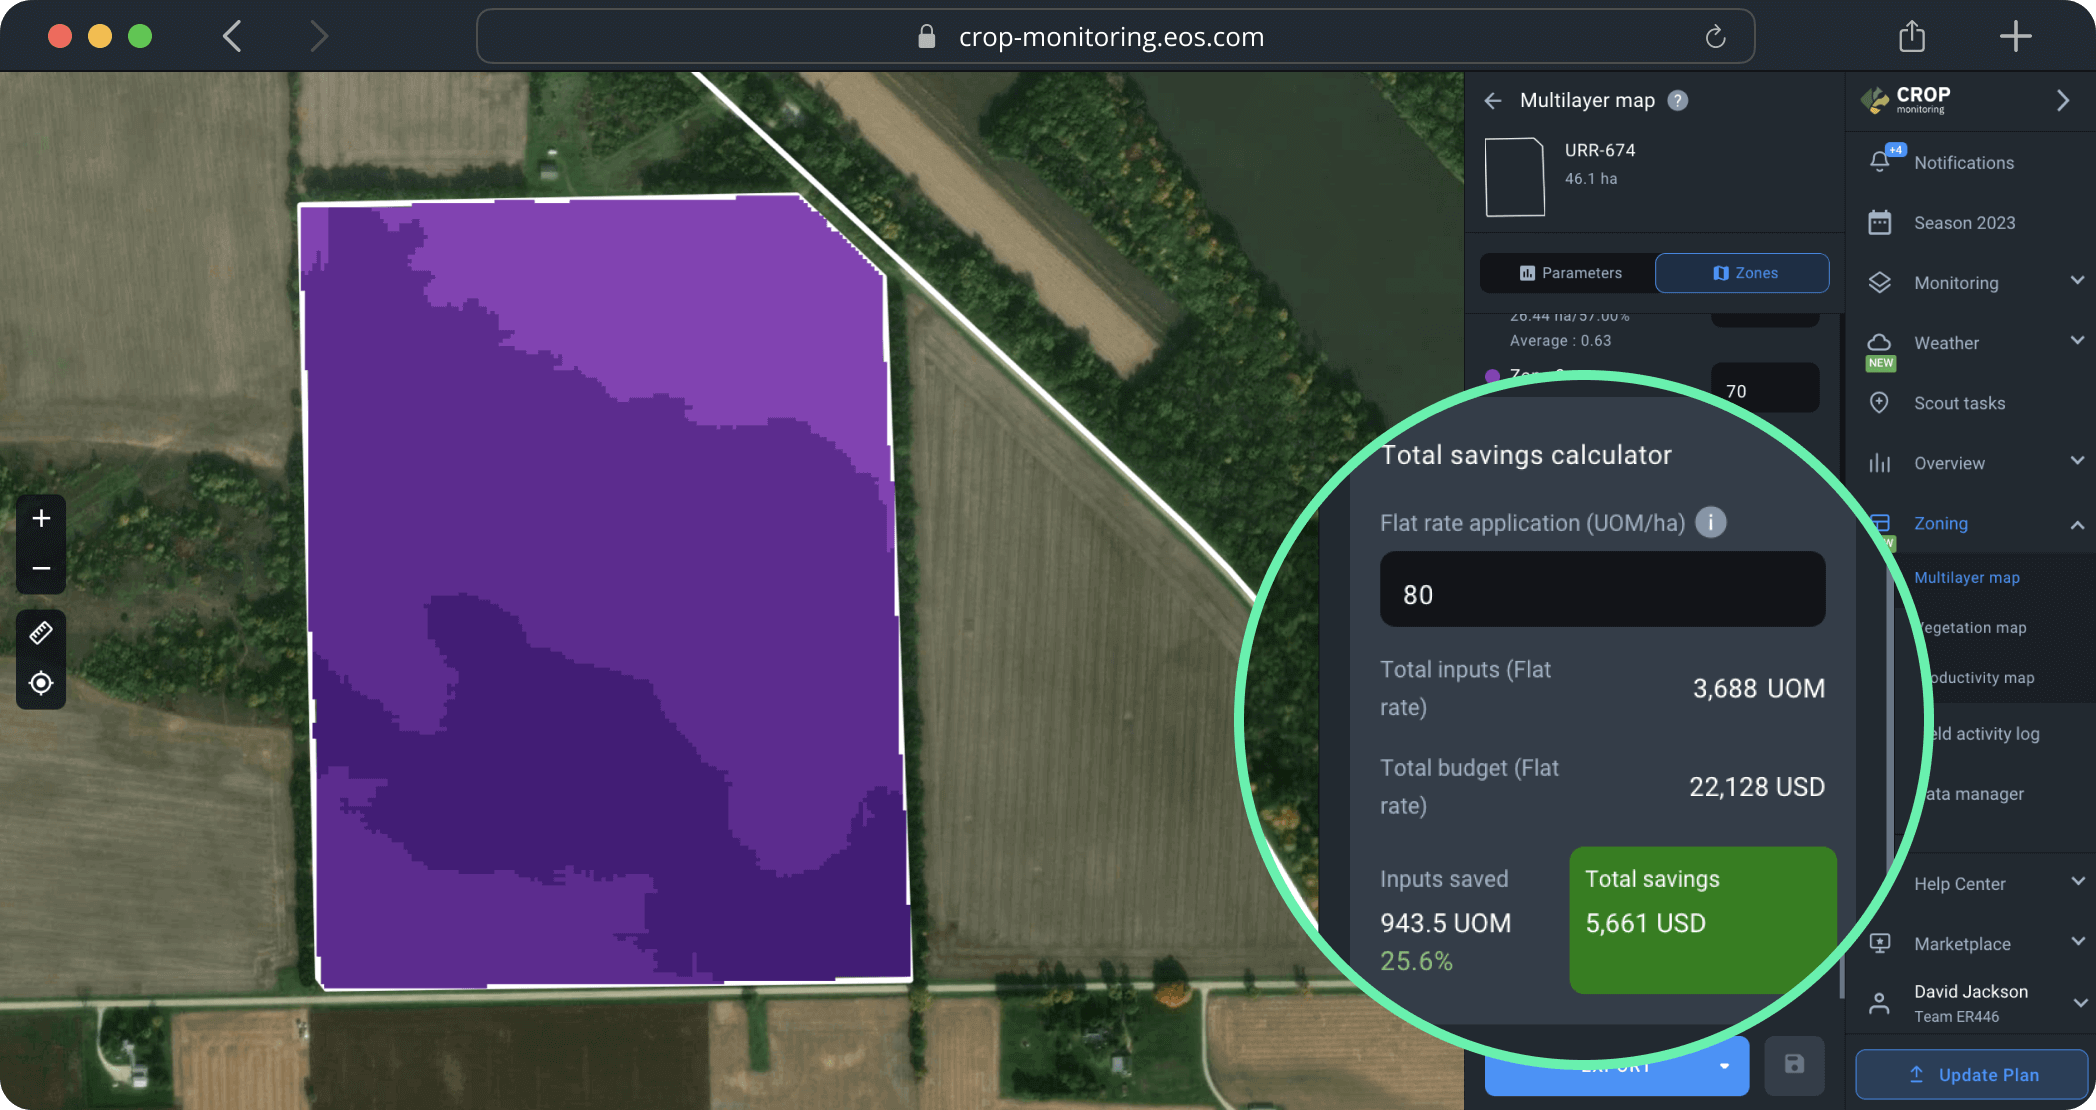
The total savings calculator will show you:
1) Total amount of fertilizer is the amount of fertilizer you would have applied using the traditional flat-rate method.
2) Total budget is the sum of money that would have been spent on the flat-rate application of fertilizer (without the help of Zoning).
3) Fertilizer saved is the amount of fertilizer saved thanks to preferring the variable-rate method to the flat-rate one.
4) Total savings is the sum of money you have saved by applying fertilizer with precision using the Zoning tool.
All of these figures will show you exactly the benefit of opting for the variable-rate application of inputs via Zoning.
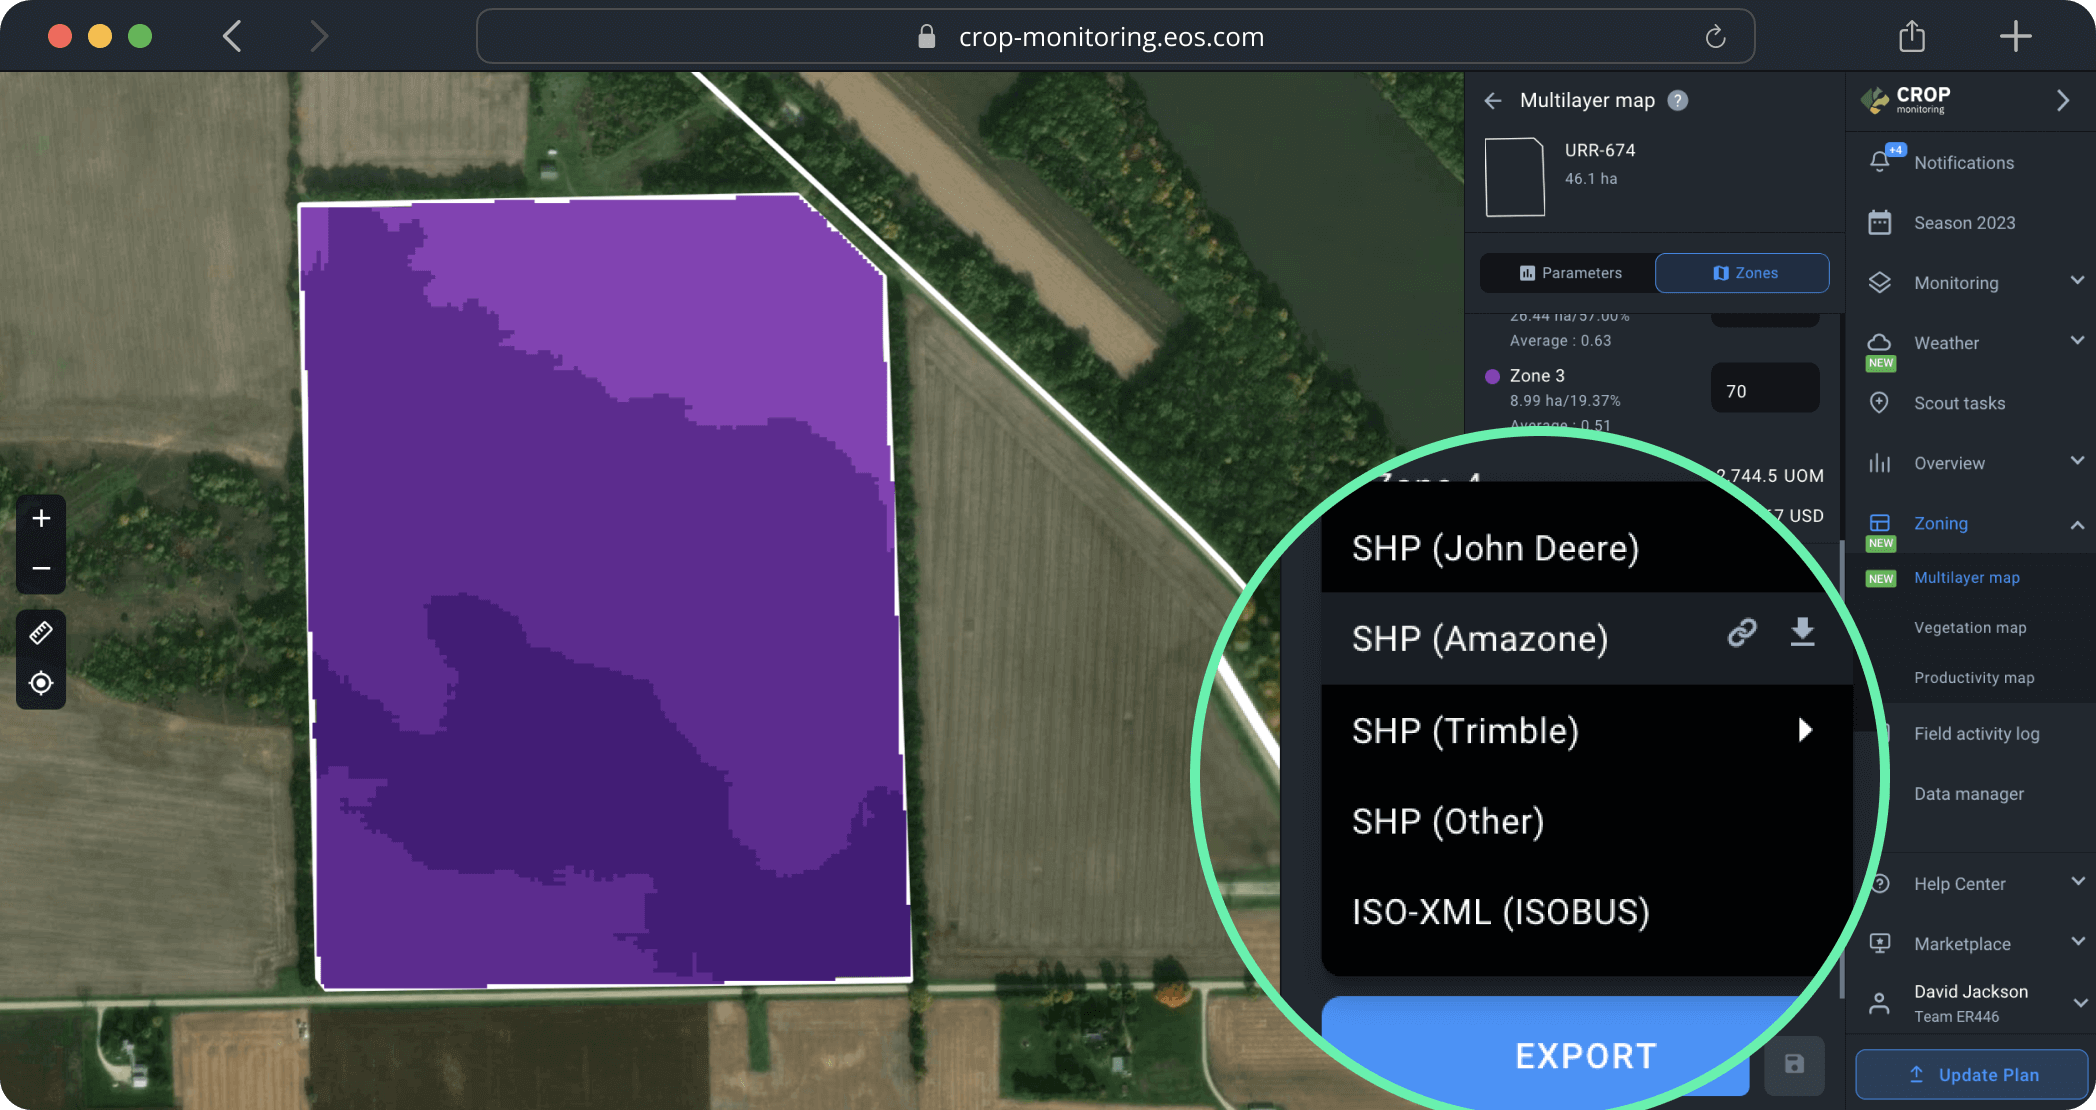
Supported formats for agriculture equipment
You can download Multilayer, Vegetation and Productivity maps as either SHP or ISO-XML files.
1) SHP format is supported by John Deere, Amazone, and Trimble. We also offer a universal SHP format to match other brands of farming equipment.
– SHP for Trimble is compatible with various display types:
- CFX 750 (FM-750), FmX (FM-1000)
- CFX-350 (XCN-750), GFX-750 (XCN-1050), TMX-2050 (XCN-2050)
2) ISO-XML format is compatible with ISOBUS equipment.
To download a file in the format that suits you best, simply select it from the drop-down list. After you click it, the download will start automatically.
Save the created maps
After you’ve created, saved, and/or downloaded a Multlayer, Vegetation or Productivity map, it will appear in the “Your maps” list on the field’s page.